All amounts are in United States dollars, unless otherwise stated.
TORONTO, Feb. 04, 2026 (GLOBE NEWSWIRE) -- Alamos Gold Inc. (TSX:AGI; NYSE:AGI) (“Alamos” or the “Company”) provided updated three-year production and operating guidance. The Company also outlined longer term production guidance of approximately one million ounces per year by 2030 through the larger expansion of the Island Gold District (announced on February 3, 2026) and initial production from Lynn Lake.
“Our operational performance over the past year was not up to our standards and not reflective of our long-term track record. We expect to deliver a stronger performance in 2026, particularly into the second half of the year as production ramps up and costs decrease with the completion of the shaft expansion at Island Gold,” said John A. McCluskey, President and Chief Executive Officer.
“As demonstrated by our three-year guidance and tremendous exploration success across our asset base, we continue to make excellent progress on our growth initiatives providing one of the strongest outlooks in the sector. We expect to deliver 46% production growth by 2028, and nearly 20% decrease in AISC. This trend is expected to continue with production expected to increase to one million ounces annually by 2030 driven by the multi phased expansion of the Island Gold District and start up of Lynn Lake. All of this growth is in Canada, its all lower cost, and we can fund it internally while generating growing free cash flow,” Mr. McCluskey added.
Three-Year Guidance Overview(1)
| 2026 | 2027 | 2028 | |
| Total Gold Production (000 oz) | 570 - 650 | 650 - 730 | 755 - 835 |
| Total Cash Costs(1) ($/oz) | $1,020 - 1,120 | $825 - 925 | $775 - 875 |
| All-in Sustaining Costs(1),(2) ($/oz) | $1,500 - 1,600 | $1,325 - 1,425 | $1,200 - 1,300 |
| Sustaining & Growth Capital(1)(3) | |||
| Operating mines ($ millions) | $333 - 375 | $275 - 315 | $240 - 280 |
| Growth Capital – Development Projects | |||
| Island Gold District Expansion ($ millions) | $240 - 260 | $130 - 145 | $80 - 90 |
| Lynn Lake ($ millions) | $140 - 160 | $380 - 410 | $290 - 310 |
| PDA ($ millions) | $137 - 145 | $15 - 20 | - |
| Total Capital ($ millions) | $850 - 940 | $800 - 890 | $610 - 680 |
(1) Refer to the “Non-GAAP Measures and Additional GAAP” disclosure at the end of this press release for a description of these measures.
(2) All-in sustaining cost guidance for 2027 and 2028 includes the same assumptions for G&A and stock-based compensation as included in 2026.
(3) Sustaining and growth capital guidance excludes capitalized exploration.
- Production expected to increase 12% in 2026 and 46% by 2028 to between 755,000 and 835,000 ounces: production guidance for 2026 decreased relative to the previous guidance1 provided in January 2025 (“Previous Guidance”), with slightly lower production from Canadian operations partially offset by an increase at the Mulatos District. Production guidance for 2027 is largely in-line with Previous Guidance and represents a 13% increase from 2026. A further 15% increase is expected in 2028, driven by the completion of the Island Gold District Expansion (“IGD Expansion”) for a cumulative 46% increase in production relative to 2025
- Further production growth to approximately one million ounces per year expected by 2030, almost doubling 2025 production:
- Lynn Lake to drive additional growth starting in 2029 with annual production expected to average 186,000 ounces over the first 10 years
- IGD Expansion to 20,000 tonnes per day (“tpd”) expected to be completed in 2028, driving further growth into 2029 and 2030 with annual production ramping up to average 534,000 ounces over the first 10 years starting in 2028 (post expansion)
- Additional longer-term upside potential through the incorporation of higher-grade regional targets within the expanded Island Gold District milling complex
- Total cash costs and AISC expected to decrease 24% and 18%, respectively, by 2028 relative to 2025:
- Costs in 2026 are expected to be consistent with 2025 and decrease steadily starting in the second half of 2026 with the completion of the shaft expansion at Island Gold
- Costs expected to continue declining through 2028 and beyond driven by low-cost growth from the Island Gold District, and initial production from Lynn Lake in 2029
- 2026 AISC guidance increased from Previous Guidance reflecting ongoing inflation, higher royalties with a 67% increase in the budgeted gold price, increased investment in critical roles across Canadian operations to support higher operating efficiency and the transition away from contractors in key areas starting in 2027, accelerated sustaining capital spending at the Island Gold District in support of the larger expansion, and additional costs from operating the Island Gold mill
- Capital spending of $850 to $940 million expected in 2026 (excluding capitalized exploration): up from Previous Guidance primarily reflecting the addition of the recently approved IGD Expansion, including accelerated spending on tailings and underground development to support the larger expansion. Total capital guidance includes:
- Sustaining capital guidance of $193 to $220 million: up from 2025 and previous guidance reflecting increased tailings capital at the Island Gold District in support of the larger expansion as mining rates increase, as well as timing of capital expenditures at Young-Davidson. A further increase is expected in 2027 and 2028 supporting growing production within the expanded Island Gold District
- Growth capital guidance of $657 to $720 million: up from 2025, reflecting the inclusion of capital for the IGD Expansion
- Capital expected to decrease approximately 28% by 2028, relative to 2026, with the completion of the IGD Expansion, followed by a further decrease in 2029 with the completion of construction at Lynn Lake
- Lynn Lake total initial capital increased to $934 million ($871 million remaining 2026+) reflecting scope changes including a larger mill, industry-wide inflation, and an extended construction timeline given the wildfires that occurred in Manitoba in 2025:
- Mill capacity to increase by 13% to 9,000 tpd, driving average annual production rates higher, in addition to other scope changes to support a larger, longer-life operation
- Other key drivers of the updated capital budget include three years of inflation since the completion of 2023 Feasibility Study, and a longer construction timeline due to the impact of Northern Manitoba wildfires in 2025
- Exploration budget increased to a record $97 million: a 35% increase from the 2025 budget with expanded programs at the Island Gold District, Young-Davidson and Lynn Lake. The expanded exploration budget is underpinned by broad-based success across the Company’s asset base in 2025
- Increasing free cash flow while funding growth:
- Free cash flow totalled approximately $350 million in 2025 while funding the Phase 3+ Expansion
- Free cash flow expected to be in excess of $500 million in 2026 at a $4,500 per ounce gold price while funding the ramp up of spending on other high-return growth projects including the IGD Expansion, Lynn Lake and PDA, as well as a record exploration budget
- Further growth to more than $1 billion of free cash flow expected in 2028 driven by growing production, and declining costs and capital with the completion of the Phase 3+ Expansion in 2026 and IGD Expansion in 2028. Additional growth expected in 2029 with initial production from Lynn Lake
- Growing free cash flow expected to support increasing returns to shareholders:
- Record $81 million returned to shareholders in 2025 through dividends and share buybacks. This included the repurchase of 1.3 million shares for $38.8 million, or $29.21 per share
- Growing returns expected to be supported by increasing free cash flow in 2027 and beyond at current gold prices
(1) Guidance statements in this release are forward-looking information. See the Assumptions and Sensitives section of this release along with the cautionary note at the end of this release. All comparisons to current and Previous Guidance are based on mid-point of the range.
Upcoming 2026 catalysts
- 2025 year-end Mineral Reserve and Resource update: February 2026
- Completion of Phase 3+ Shaft Expansion: Q4 2026
- Exploration updates across assets: ongoing
2026 Guidance
| 2026 Guidance | 2025 Guidance(1) | |||||
| Island Gold District | Young- Davidson | Mulatos District | Lynn Lake | Total | Total | |
| Gold production (000 oz) | 290 - 330 | 155 - 175 | 125 - 145 | 570 - 650 | 545 | |
| Cost of sales, including amortization ($ millions)(2) | ~$920 | ~$810 | ||||
| Cost of sales, including amortization ($/oz)(2) | $1,450 - 1,550 | ~$1,525 | ||||
| Total cash costs ($/oz)(3) | $875 - 975 | $1,350 - 1,450 | $930 - 1,030 | - | $1,020 - 1,120 | ~$1,080 |
| All-in sustaining costs ($/oz)(3) | $1,500 - 1,600 | ~$1,525 | ||||
| Mine-site all-in sustaining costs ($/oz)(3)(4) | $1,340 - 1,440 | $1,730 - 1,830 | $1,000 - 1,100 | - | ||
| Capital expenditures ($ millions) | ||||||
| Sustaining capital(3)(5) | $135 - 150 | $55 - 65 | $3 - 5 | - | $193 - 220 | $138 - 150 |
| Growth capital(3)(5) | $355 - 385 | $25 - 30 | $137 – 145 | $140 - 160 | $657 - 720 | $362 - 410 |
| Total Sustaining and Growth Capital(3)(5) ($ millions) | $490 - 535 | $80 - 95 | $140 - 150 | $140 - 160 | $850 - 940 | $500 - 560 |
| Capitalized exploration(3) ($ millions) | $33 | $12 | $9 | $6 | $60 | $39 |
| Total capital expenditures and capitalized exploration(3) ($ millions) | $523 - 568 | $92 - 107 | $149 - 159 | $146 - 166 | $910 – 1,000 | $539 - 599 |
(1) 2025 actuals are preliminary; final figures will be released with fourth quarter and full year results to be reported on February 18, 2026
(2) Cost of sales includes mining and processing costs, royalties, and amortization expense but excludes silver credit, and is calculated based on the mid-point of total cash cost guidance.
(3) Refer to the "Non-GAAP Measures and Additional GAAP" disclosure at the end of this press release for a description of these measures.
(4) For the purposes of calculating mine-site all-in sustaining costs at individual mine sites the Company allocates a portion of share based compensation to the mine sites, but does not include an allocation of corporate and administrative expenses to the mine sites.
(5) Sustaining and growth capital guidance excludes capitalized exploration.
Consolidated production is expected to increase 12% from 2025 to a range of between 570,000 and 650,000 ounces. This is expected to be driven by the ramp up of underground mining rates through the year at Island Gold in conjunction with the completion of the Phase 3+ Expansion towards the end of 2026, as well as increased mining rates at Young-Davidson. Production is expected to be higher in the second half of the year driven by the ongoing ramp up at Island Gold.
Compared to Previous Guidance, 2026 production guidance is approximately 7% lower reflecting slightly lower production from the Canadian operations, partially offset by an increase from the Mulatos District. This reflects slightly lower grades at Young-Davidson, and a more conservative ramp up of underground mining rates at Island Gold with the shaft to be operational toward the end of 2026.
Total cash costs and AISC per ounce are expected to be consistent with 2025 and trend lower through the year. Costs are expected to be above the full year guidance range in the first half of the year, with a significant decrease expected into the second half of 2026 driven by the ramp up of underground mining rates at Island Gold. A further decrease in costs is expected in each of 2027 and 2028.
Total cash costs and AISC guidance have both increased relative to Previous Guidance reflecting inflation of approximately 5%, increased royalties given the substantially higher gold price, slightly lower grades at Young-Davidson, and a larger investment in key roles across the Canadian operations to drive increased operating efficiency. The added labour complement will support the transition away from contractors starting in 2027 within certain segments of the Canadian operations, including maintenance and underground development.
AISC have also increased due to higher sustaining capital. This reflects additional investment in critical spares to minimize any unplanned downtime at all operations, and accelerated spending on tailings lifts and other sustaining capital to support the larger expansion of the Island Gold District.
Costs and Capital Spending Expected to Decrease Significantly in H2 2026
| H1 2026 | H2 2026 | 2026 Guidance | |||
| Total gold production (000 oz) | 270 - 310 | 300 - 340 | 570 - 650 | ||
| Total cash costs(1) ($/oz) | $1,100 - 1,200 | $975 - 1,075 | $1,020 - 1,120 | ||
| All-in sustaining costs(1) ($/oz) | $1,625 - 1,725 | $1,400 - 1,500 | $1,500 - 1,600 | ||
| Total capital expenditures and capitalized exploration(1) ($ millions) | $500 - 550 | $410 - 450 | $910 - 1,000 | ||
(1) Refer to the "Non-GAAP Measures and Additional GAAP" disclosure at the end of this press release for a description of these measures.
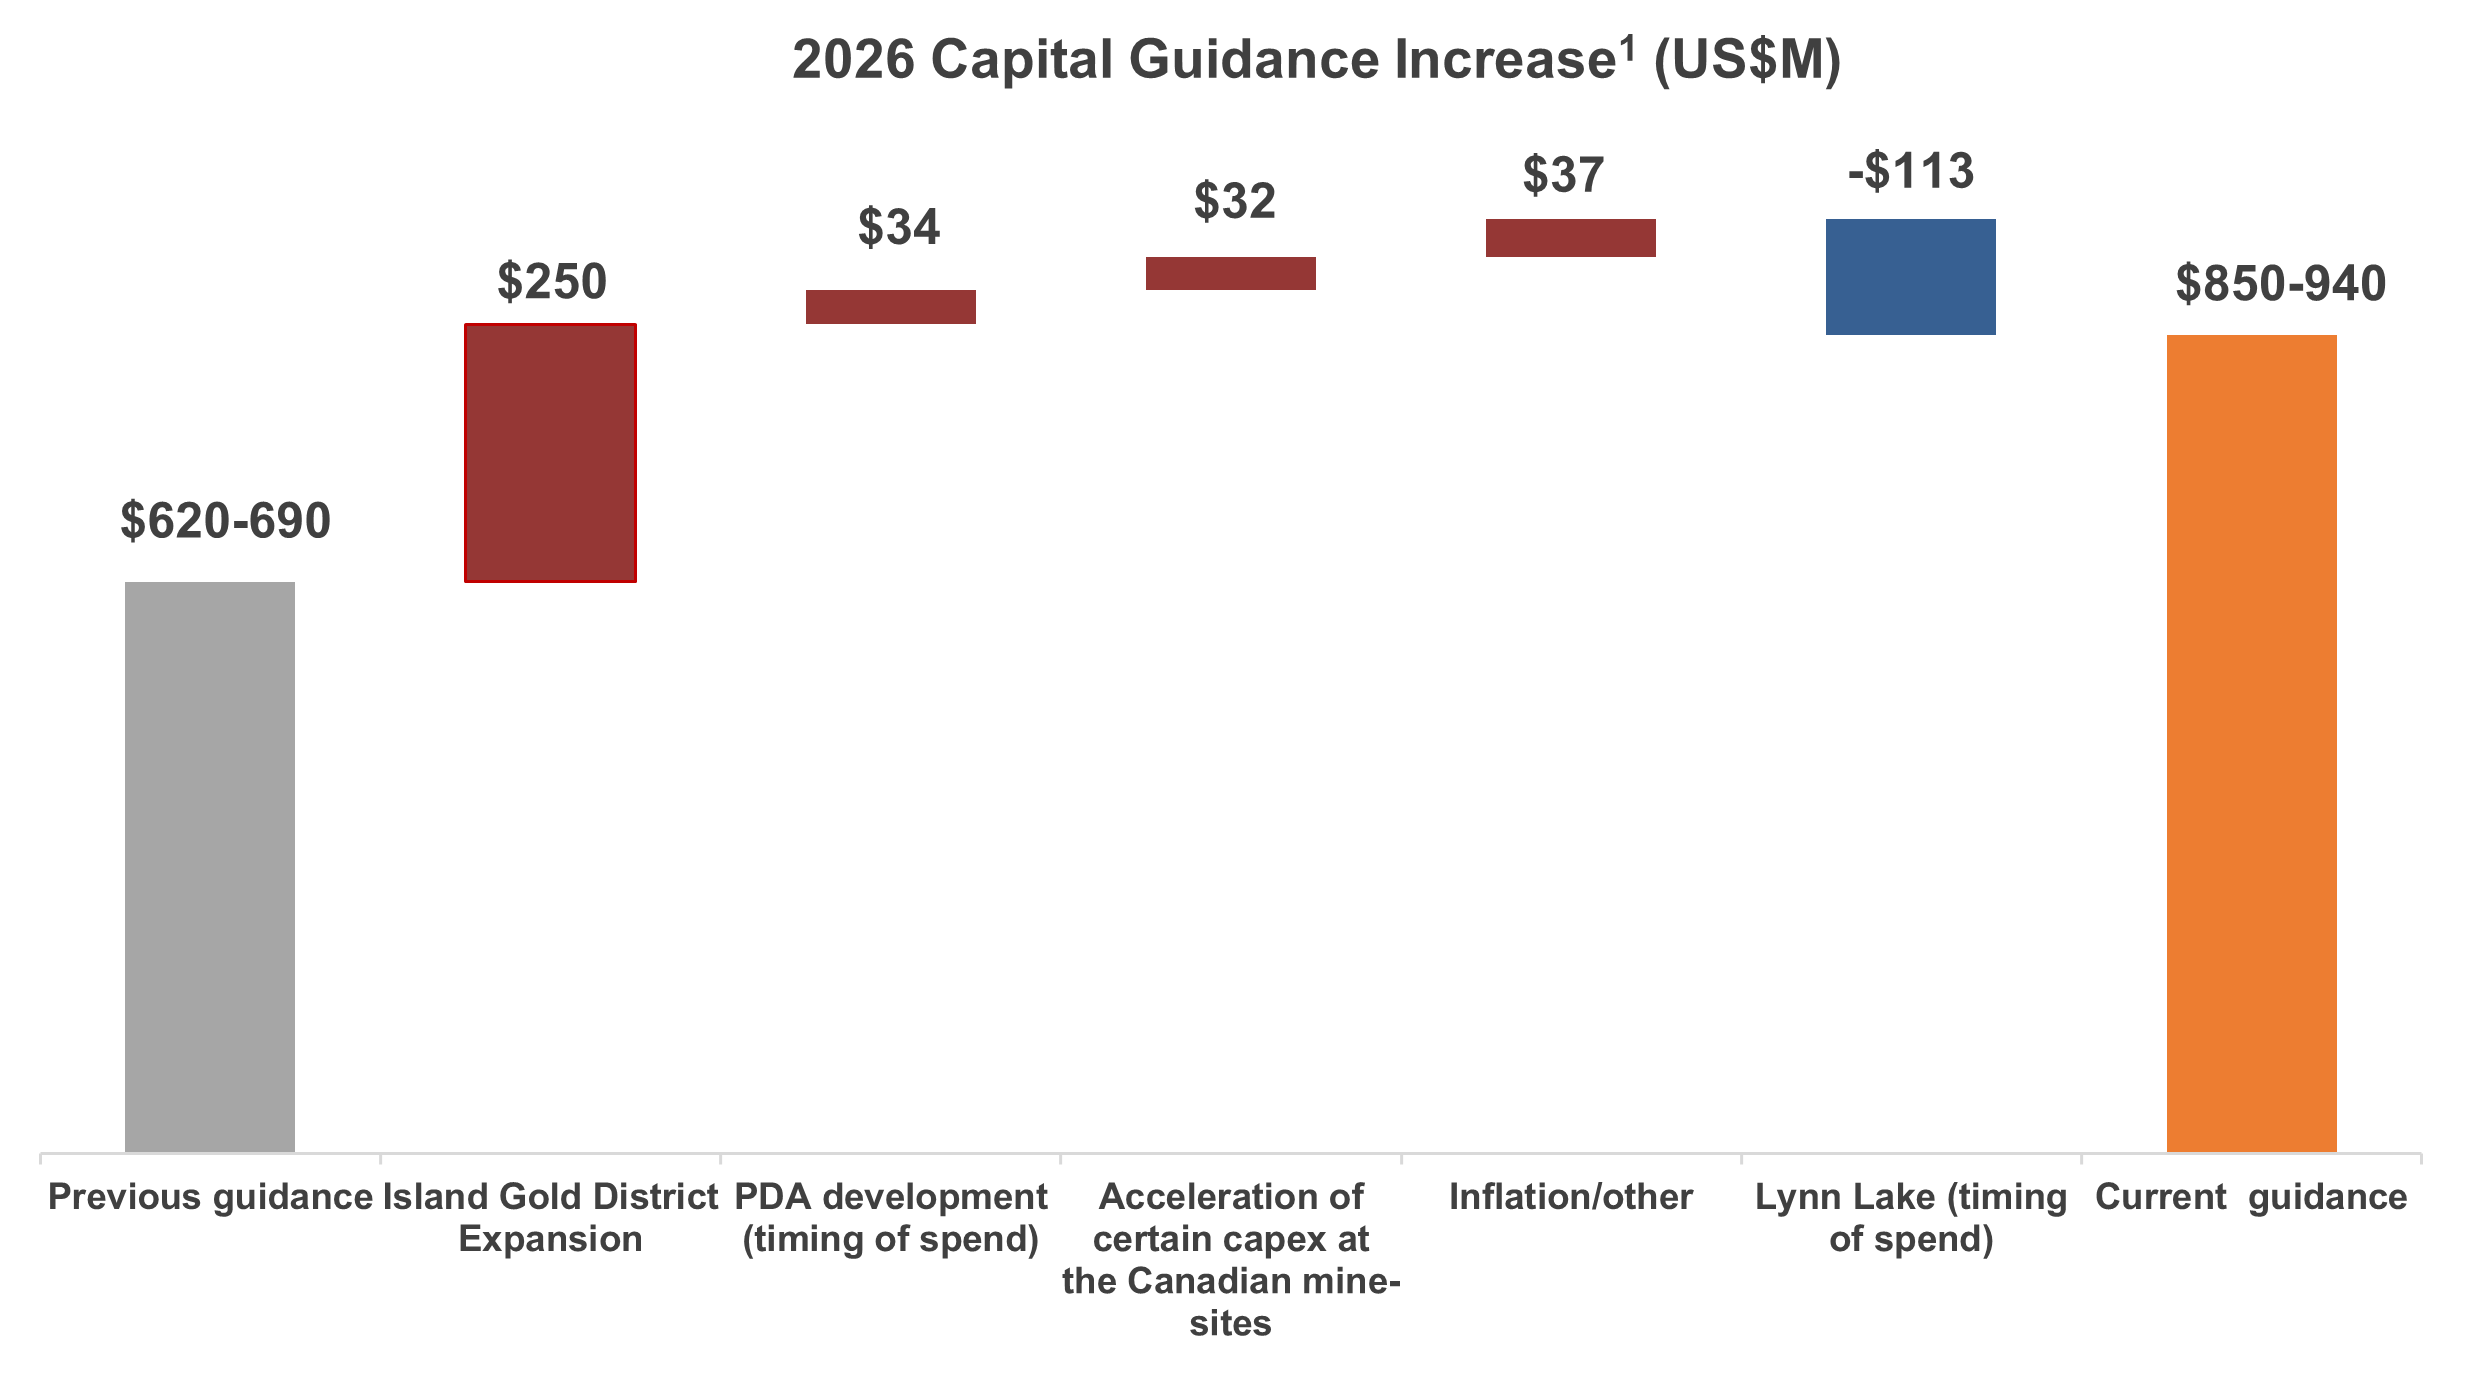
Capital spending is expected to increase from 2025, and previous guidance for 2026, to a range of $850 to $940 million, excluding capitalized exploration of $60 million. This reflects the inclusion of capital for the IGD Expansion, acceleration of certain capital expenditures at the Canadian mine-sites, and ongoing inflation.
Island Gold District capital spending is expected to total $490 to $535 million, including $355 to $385 million of growth capital. Approximately one-third of the growth capital is expected to be attributable to the completion of the Phase 3+ Expansion, including the shaft infrastructure and paste plant. The remainder will be focused on the IGD Expansion, which entails expanding the Magino mill to 20,000 tpd, and accelerating underground development and increasing mobile equipment to support higher underground and open pit mining rates over the longer-term.
Capital spending on PDA in 2026 is expected to range between $137 and $145 million, with the majority of the spend on advancing underground development and mill construction. Total initial capital estimate of $165 million for PDA remains unchanged and the project remains on track for initial production mid-2027.
Construction activities at Lynn Lake are expected to restart in the spring of 2026 with spending expected to total between $140 and $160 million. This represents a 43% decrease from the previous guidance for 2026, reflecting the previously disclosed deferral of construction activities due to wildfires in Northern Manitoba in 2025. Capital spending on Lynn Lake is expected to increase into 2027 and 2028 during peak construction and then decrease into 2029 with initial production expected in the first half of 2029.
Capital spending is expected to be first half weighted in 2026, though will vary by asset. Spending at the Island Gold District is expected to be first half-weighted while spending at Lynn Lake is expected to ramp up into the second half of the year.
 (1) Capital guidance excludes capitalized exploration.
2026 – 2028 Guidance
| 2026 | 2027 | 2028 | |||
| Current | Previous | Current | Previous | Current | |
| Gold Production (000 oz) | |||||
| Island Gold District | 290 - 330 | 330 - 355 | 380 - 420 | 375 - 400 | 470 - 510 |
| Young-Davidson | 155 - 175 | 180 - 195 | 155 - 175 | 180 - 195 | 155 - 175 |
| Mulatos District | 125 - 145 | 120 - 130 | 115 - 135 | 125 - 135 | 130 - 150 |
| Total Gold Production (000 oz) | 570 - 650 | 630 - 680 | 650 - 730 | 680 - 730 | 755 - 835 |
| Total Cash Costs(1) ($/oz) | $1,020 - 1,120 | $800 - 900 | $825 - 925 | $775 - 875 | $775 - 875 |
| All-in Sustaining Costs(1),(2) ($/oz) | $1,500 - 1,600 | $1,150 - 1,250 | $1,325 - 1,425 | $1,125 - 1,225 | $1,200 - 1,300 |
| Sustaining capital(1),(3) ($ millions) | $193 - 220 | $160 - 175 | $235 - 255 | $180 - 200 | $210 - 235 |
| Growth capital – operating mines(1),(3) ($ millions) | $140 - 155 | $105 - 130 | $40 – 60 | $20 - 25 | $30 - 45 |
| Sustaining & growth capital(1),(3) - operating mines ($ millions) | $333 - 375 | $265 - 305 | $275 - 315 | $200 - 225 | $240 - 280 |
| Island Gold District Expansion ($ millions) | $240 - 260 | - | $130 - 145 | - | $80 - 90 |
| Lynn Lake ($ millions) | $140 - 160 | $250 - 275 | $380 - 410 | $235 - 260 | $290 - 310 |
| PDA ($ millions) | $137 - 145 | $105 - 110 | $15 - 20 | $15 - 20 | - |
| Total sustaining & growth capital(1),(3)($ millions) | $850 - 940 | $620 - 690 | $800 - 890 | $450 - 505 | $610 - 680 |
(1) Refer to the “Non-GAAP Measures and Additional GAAP” disclosure at the end of this press release for a description of these measures.
(2) All-in sustaining cost guidance for 2027 and 2028 includes the same assumptions for G&A and stock based compensation as included in 2025.
(3) Sustaining and growth capital guidance excludes capitalized exploration.
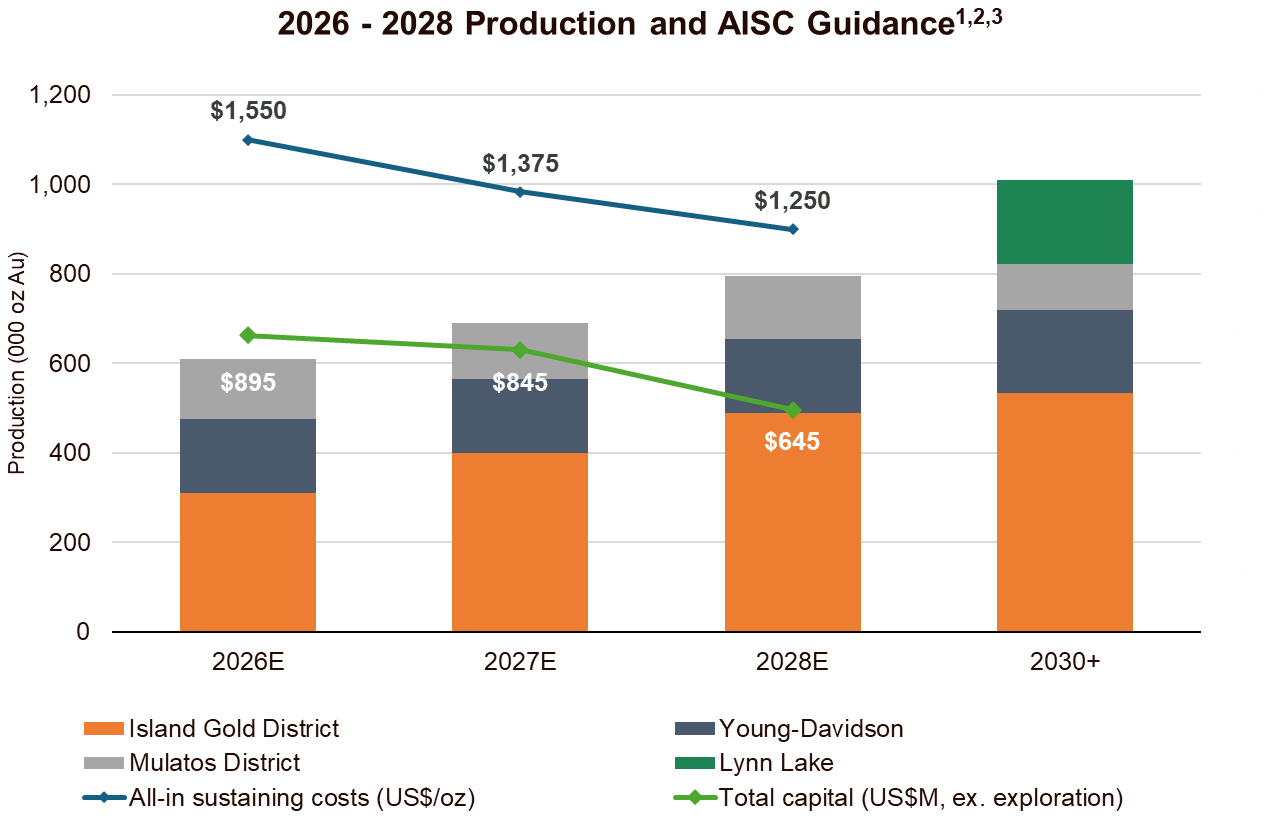
Gold production is expected to increase to a range of between 650,000 and 730,000 ounces in 2027, a 13% increase from 2026, and 27% increase from 2025. The Island Gold District is expected to drive this growth with 2027 representing the first full year operating from the new shaft infrastructure, supporting higher underground mining rates. The completion of the IGD Expansion in 2028 is expected to drive a further increase in production to a range of 755,000 to 835,000 ounces, representing a 15% increase from 2027 and cumulative 46% increase from 2025.
Further growth is expected into 2029 with initial production from Lynn Lake, and the ramp up of underground mining rates at Island Gold to 3,000 tpd, as outlined in the IGD Expansion Study. By 2030, production is expected to increase to a rate of approximately one million ounces annually.
Total cash costs and AISC in 2027 are expected to decrease 18% and 11%, respectively, from 2026 driven by low-cost growth from the Island Gold District with the completion of the shaft and connecting the Magino mill to low-cost grid power.
A further decrease in costs is expected into 2028 with AISC expected to be in the range of between $1,200 and $1,300 per ounce. This represents a 9% decrease from 2027 and nearly 20% decrease from 2025. This is expected to be driven by the first full year of production from PDA in Mexico and a further increase in low-cost production from the Island Gold District with the completion of the IGD Expansion.
Costs are expected to continue decreasing into 2029 and 2030 with the ramp up of underground mining rates at Island Gold to 3,000 tpd, as outlined in the IGD Expansion Study, and the start of production from the low-cost Lynn Lake project.
Capital spending is expected to decline slightly in 2027 with increased spending at Lynn Lake offset by lower spending on PDA and the Island Gold District. In 2028, capital spending is expected to decrease approximately 24% compared to 2027 as the IGD Expansion is completed. A more significant decrease is expected into 2029 and 2030 with the completion of construction at Lynn Lake.
(1) Production and AISC are based on mid-point of guidance.
(2) Refer to the “Non-GAAP Measures and Additional GAAP” disclosure at the end of this press release for a description of these measures.
(3) Total consolidated all-in sustaining costs include corporate and administrative and share based compensation expenses.
Island Gold District
| Guidance | ||||
| Island Gold District | 2025A | 2026E | 2027E | 2028E |
| Gold Production (000 oz) | 250 | 290 - 330 | 380 - 420 | 470 - 510 |
| Previous Guidance (000 oz) | 330 - 355 | 375 - 400 | ||
| Island Gold District costs | ||||
| Total Cash Costs(1)(2) ($/oz) | ~$1,045 | $875 - 975 | ||
| Mine-site AISC(1),(2),(3) ($/oz) | ~$1,475 | $1,340 - 1,440 | ||
| Island Gold (Underground) | ||||
| Tonnes of ore processed5 (tpd) | 1,159 | 1,400 - 2,000 | ||
| Grade processed (g/t Au) | 11.69 | 9.0 - 11.5 | ||
| Average recovery rate (%) | 98% | ~97% | ||
| Magino (Open Pit) (4) | ||||
| Tonnes of ore mined (tpd) | 14,973 | 16,000 - 20,000 | ||
| Grade mined (g/t Au) | 0.82 | 0.70 - 0.80 | ||
| Tonnes of ore processed (tpd) | 8,232 | 7,800 - 9,200 | ||
| Grade processed (g/t Au) | 1.34 | 1.00 - 1.10 | ||
| Average recovery rate (%) | 95% | ~95 % | ||
| Island Gold District | ||||
| Tonnes of ore processed – Total (tpd) | 9,169 | 9,200 - 11,200 | ||
| Grade processed – Total (g/t Au) | 2.39 | 2.40 - 2.80 | ||
| Average recovery rate – Total (%) | 97% | 96 - 97% | ||
| Sustaining capital(1) ($ millions) | - | $135 - 150 | ||
| Growth capital(1) ($ millions) | - | $355 - 385 | ||
| Total sustaining & growth capital(1) (ex. exploration) ($ millions) | - | $490 - 535 | ||
| Capitalized exploration(1) ($ millions) | - | $33 |
(1) Refer to the “Non-GAAP Measures and Additional GAAP” disclosure at the end of this press release and the Q3 2025 MD&A for a description and calculation of these measures.
(2) 2025 actuals are preliminary; final figures will be released with fourth quarter and full year results to be reported on February 18, 2026
(3) For the purposes of calculating mine-site all-in sustaining costs at individual mine sites the Company allocates a portion of share based compensation to the mine sites, but does not include an allocation of corporate and administrative expenses to the mine sites.
(4) Magino mill results include the processing of open pit ore from Magino and excess underground ore not processed within the Island Gold mill.
(5) Island Gold average milling rates exclude the period where mill was on care and maintenance between July 16 and September 23, 2025.
Production from the Island Gold District is expected to increase 24% in 2026, compared to 2025, driven by the ramp up of underground mining rates. Mining rates are expected to increase from 1,400 tpd at the start of the year to 2,000 tpd by the end of 2026, coinciding with the completion of the shaft infrastructure. Underground grades mined are also expected to increase through the year from approximately 9 g/t Au in the first quarter to 11.5 g/t Au in in the fourth quarter, with the full year averaging close to the Mineral Reserve grade. Given the increase in underground mining rates and grades through the year, production is expected to be weighted to the second half of the year.
Underground mining rates are expected to continue increasing to 2,400 tpd early in 2027 driving a further increase in production into 2027. Following the completion of the IGD Expansion in 2028, underground mining rates are expected to increase by 2029 to a long-term rate of 3,000 tpd, all supported by the shaft infrastructure expected to be completed in the fourth quarter of 2026. The ramp up in underground mining rates and completion of the IGD Expansion in 2028 are expected to drive significant growth over the next three years with 2028 production approximately double 2025 levels.
Compared to Previous Guidance, 2026 production is expected to be 9% lower reflecting decreased milling rates from the Magino mill and a slightly slower ramp up of underground mining rates to 2,400 tpd. With the shaft expected to be operational towards the end of 2026, mining rates are now expected to ramp up to planned rates of 2,400 tpd early in 2027, compared to the fourth quarter of 2026 previously.
Open pit mining rates are expected to average approximately 18,000 tpd of ore through the year, an increase over 2025 mining rates when more waste was being mined. Approximately 7,800 to 9,200 tpd of the higher-grade open pit ore will be processed through the Magino mill with milled grades for open pit ore expected to be between 1.0 and 1.1 g/t Au.
The Island Gold mill will continue to be operational until the Magino mill expansion to 20,000 tpd is completed in 2028. Underground ore will be processed at the Island Gold mill at a rate of approximately 1,265 tpd with underground ore mined above that level to be processed within the Magino mill. The remaining ore feed to the Magino mill will be from the open pit.
Total cash costs and mine-site AISC are expected to decrease approximately 11% and 6%, respectively in 2026, relative to 2025. Costs are expected to decrease through the year, particularly into the second half of 2026 reflecting increasing underground mining rates, and the completion of the shaft towards the end of 2026. Mine-site AISC for 2026 reflects higher royalty costs, ongoing labour inflation, increased investment in critical roles to support higher operating efficiency, higher processing costs associated with running the Island Gold mill, and accelerated sustaining capital spending in support of the IGD Expansion to 20,000 tpd. This includes increased tailings capital and underground development.
Capital spending at the Island Gold District (excluding exploration) is expected to be in the range of between $490 and $535 million in 2026, an increase over 2025 primarily due to the inclusion of capital for the IGD Expansion. Capital spending will be higher in the first half of the year as the focus will be on completing the Phase 3+ Expansion. Approximately one-third of growth expenditures are attributable to completing the Phase 3+ Expansion with the remainder of growth capital associated with the larger IGD Expansion.
The Phase 3+ Expansion is expected to be completed in the fourth quarter of 2026 with remaining spending focused on completing the final 29 metres of the shaft sink to the planned ultimate depth of 1,379 metres, as well as completing construction of the 1350-level loading pocket, paste plant and power line project. The power line project is expected to connect the Magino mill to lower cost grid power by the end of 2026, eliminating the reliance on Compressed Natural Gas (“CNG”) for power generation. In addition to driving significant processing cost savings into 2027, this is also expected to provide a more reliable source of power for the mill.
Capital spending on the IGD Expansion will be focused on construction of the new parallel circuit as part of the mill expansion to 20,000 tpd, accelerated underground development, and additional open pit and underground mobile equipment to support higher underground and open pit mining rates.
Young-Davidson
| Guidance | ||||
| Young-Davidson | 2025A | 2026E | 2027E | 2027E |
| Gold Production (000 oz) | 153 | 155 - 175 | 155 - 175 | 155 - 175 |
| Previous Guidance (000 oz) | 180 - 195 | 180 - 195 | ||
| Total Cash Costs(1),(2) ($/oz) | ~$1,245 | $1,350 - 1,450 | ||
| Mine-site AISC(1),(2),(3) ($/oz) | ~$1,635 | $1,730 - 1,830 | ||
| Tonnes of ore processed (tpd) | 7,413 | 7,600 - 8,000 | ||
| Grade processed (g/t Au) | 1.94 | 1.90 - 2.05 | ||
| Average recovery rate (%) | 91% | 90 - 92% | ||
| Sustaining capital(1) ($ millions) | - | $55 - 65 | ||
| Growth capital(1) ($ millions) | - | $25 - 30 | ||
| Total sustaining & growth capital(1) (ex. exploration) ($ millions) | - | $80 - 95 | ||
| Capitalized exploration(1) ($ millions) | - | $12 |
(1) Refer to the "Non-GAAP Measures and Additional GAAP" disclosure at the end of this press release and the Q3 2025 MD&A for a description and calculation of these measures.
(2) 2025 actuals are preliminary; final figures will be released with fourth quarter and full year results to be reported on February 18, 2026
(3) For the purposes of calculating mine-site all-in sustaining costs at individual mine sites the Company allocates a portion of share based compensation to the mine sites, but does not include an allocation of corporate and administrative expenses to the mine sites.
Gold production at Young-Davidson is expected to increase approximately 8%, relative to 2025, driven by higher underground mining rates. Mining rates are expected to average approximately 7,600 tpd in the first quarter given increased ore pass availability and capacity. A new ore pass will be commissioned during the first quarter, such that four will be available by the second quarter, compared to two for much of the fourth quarter of 2025. This is expected to provide additional operational flexibility and support increased mining rates of approximately 8,000 tpd in the second quarter and through the rest of the year.
Compared to the previous 2026 guidance, production is approximately 12% lower primarily due to lower grades mined. Grades mined are expected to be between 1.90 and 2.05 g/t Au in 2026, similar to 2025. Grades are expected to remain at similar levels through 2030, after which grades are expected to increase to average closer to Mineral Reserve grade.
Total cash costs and mine-site AISC are expected to increase approximately 12% and 9%, respectively, from 2025. The key drivers of the increase reflect higher royalty costs, ongoing cost inflation, in particular for labour, as well as increased sustaining capital to support targeted mining rates of 8,000 tpd. Total cash costs and AISC are expected to remain at similar levels in 2027 and 2028.
Capital spending in 2026 (excluding exploration) is expected to be between $80 and $95 million, an increase over 2025. This is primarily due to an increased investment in capital spares to minimize potential unplanned downtime, increase underground development to support greater operational flexibility, as well as acceleration of the next tailings lift. Capital spending is expected to remain at similar levels in 2027 and 2028.
Young-Davidson generated approximately $250 million of mine-site free cash flow in 2025. With a 14-year Mineral Reserve life and significant exploration upside, Young-Davidson is well-positioned to generate similar levels of free cash flow over the longer term at current gold prices.
Mulatos District
| Guidance | ||||
| Mulatos District | 2025A | 2026E | 2027E | 2028E |
| Gold Production (000 oz) | 142 | 125 - 145 | 115 - 135 | 130 - 150 |
| Previous Guidance (000 oz) | 120 - 130 | 125 - 135 | ||
| Total Cash Costs(1),(2)($/oz) | ~$950 | $930 - 1,030 | ||
| Mine-site AISC(1),(2),(3) ($/oz) | ~$1,020 | $1,000 - 1,100 | ||
| La Yaqui Grande | ||||
| Tonnes of ore stacked (tpd) | 11,300 | 10,000 - 11,000 | - | - |
| Grades stacked (g/t Au) | 1.26 | 0.70 - 1.40 | - | - |
| Recovery ratio (%) | 64% | ~90% | - | - |
| Sustaining capital(1) ($ millions) | - | $3 - 5 | ||
| Growth capital(1) ($ millions) | - | $137 - 145 | ||
| Total sustaining & growth capital(1) (ex. exploration) ($ millions) | - | $140 - 150 | ||
| Capitalized exploration(1) ($ millions) | - | $9 |
(1) Refer to the "Non-GAAP Measures and Additional GAAP" disclosure at the end of this press release and the Q3 2025 MD&A for a description and calculation of these measures.
(2) 2025 actuals are preliminary; final figures will be released with fourth quarter and full year results to be reported on February 18, 2026
(3) For the purposes of calculating mine-site all-in sustaining costs at individual mine sites the Company allocates a portion of share based compensation to the mine sites, but does not include an allocation of corporate and administrative expenses to the mine sites.
Combined gold production from the Mulatos District is expected to be between 125,000 and 145,000 ounces in 2026, an 8% increase from previous guidance. The increase is due to the expected recovery of previously stacked ounces on the leach pad at La Yaqui Grande and continued residual leaching of the main Mulatos leach pad. Production from La Yaqui Grande will continue to account for the vast majority of production in 2026.
Grades mined and stacked at La Yaqui Grande are expected to be at the top end of guidance early in the year and decline through the year towards the lower end of guidance. Additionally, ounces produced from residual leaching at Mulatos are expected to decrease through the year, such that approximately 55% of the annual production is expected within the first half of the year.
Total cash costs and mine-site AISC in 2026 are expected to be consistent with 2025 costs. Reflecting the cadence of production through the year, costs are expected to be below the low end of guidance during the first half of the year and above the high end in the second half of the year.
Production is expected to decrease approximately 7% in 2027 reflecting the end of residual leaching from the main Mulatos leach pad, and wind down of mining operations at La Yaqui Grande with the depletion of the open pit. This is expected to coincide with the start of production from PDA by mid-2027, keeping production from the Mulatos District relatively stable. The PDA project has a 9-year mine life based on Mineral Reserves as of the end of 2024 with significant exploration upside at PDA, and other higher-grade sulphide targets, including Cerro Pelon and Halcon.
Capital spending (excluding exploration) is expected to total $140 to $150 million in 2026, an increase from 2025 reflecting the timing of spending with the majority of the overall PDA project budget expected to be incurred in 2026. Capital spending at PDA will be focused on advancing underground development and mill construction. The total initial capital estimate of $165 million for PDA is unchanged, and the project remains on track for initial production mid-2027.
Lynn Lake Project Update
In February 2025, an internal economic study and development plan was released on the Burnt Timber ("BT") and Linkwood satellite deposits located in proximity to the Lynn Lake project. The BT and Linkwood deposits are expected to provide a source of additional mill feed to the Lynn Lake project, extending the combined mine life of the Lynn Lake project to 27 years (from 17), increase longer term rates of production, and enhance the overall economics.
Given the impact of wildfires and evacuation orders in Northern Manitoba in 2025, the planned ramp up of construction activities on the Lynn Lake project was delayed. With the evacuation order lifted, the project team returned to site late in 2025. Limited construction activities are planned during the winter months with construction activities expected to resume during the spring of 2026, which is the more cost-effective and lower risk approach.
With the delays in ramping up construction activities and significantly longer mine life, incorporating the BT and Linkwood deposits, the Company has re-engineered and optimized a number of elements within the broader Lynn Lake development plan. This includes several scope changes, most notably increasing the mill capacity by 13% to 9,000 tpd, driving production higher and stronger economics.
Reflecting scope changes to support a larger operation, three years of inflation since the 2023 Feasibility Study, and the longer construction timeline due to the 2025 wildfires, initial capital for the project has increased to $937 million, with $871 million remaining to be spent as of the start of 2026. This is up from $632 million in the 2023 Feasibility Study which was based on 2022 costing.
The updated parameters for the Lynn Lake Project, incorporating the revised capital, larger Mineral Reserve base including BT and Linkwood, and increased mill throughput, are as follows:
- Average annual production of 186,000 ounces over the initial 10 years
- Low mine-site AISC of $829 per ounce over the initial 10 years ($1,039 per ounce over the life of mine)
- Long mine life of 25 years with total production of three million ounces (based on Mineral Reserves at the end of 2024)
- Attractive economics with significant near-mine and regional exploration upside
Capital spending on the Lynn Lake project in 2026 is expected to be between $140 and $160 million, a decrease from the previous 2026 guidance reflecting the delay in construction ramp up. Spending is expected to be second half-weighted with a gradual ramp up in the first half of the year. Construction activities in 2026 include permanent camp construction, bulk earthworks, power infrastructure upgrades, and orders for long lead-time items.
The majority of initial capital will be spent in 2027 and 2028, with first production expected in the first half of 2029. With attractive economics and significant exploration upside, the Lynn Lake project is a key component of the Company’s leading high-return organic growth profile.
2026 Global Operating and Development Capital Budget
| 2026 Guidance | |||||||
| Sustaining Capital(1) | Growth Capital(1) | Total | |||||
| Operating Mines ($ millions) | |||||||
| Island Gold District | $135 - 150 | $355 – 385 | $490 – 535 | ||||
| Young-Davidson | $55 - 65 | $25 - 30 | $80 – 95 | ||||
| Mulatos District | $3 - 5 | $137 - 145 | $140 - 150 | ||||
| Total – Operating Mines | $193 - 220 | $517 - 560 | $710 - 780 | ||||
| Development Projects ($ millions) | |||||||
| Lynn Lake | - | $140 - 160 | $140 - 160 | ||||
| Total – Development Projects | - | $140 - 160 | $140 - 160 | ||||
| Capitalized Exploration(1) ($ millions) | |||||||
| Island Gold District | - | $33 | $33 | ||||
| Young-Davidson | - | $12 | $12 | ||||
| Mulatos District | - | $9 | $9 | ||||
| Lynn Lake | - | $6 | $6 | ||||
| Total – Capitalized Exploration(1) | - | $60 | $60 | ||||
| Total Consolidated Budget ($ millions) | $193 - 220 | $717 - 780 | $910 – 1,000 | ||||
(1) Refer to the "Non-GAAP Measures and Additional GAAP" disclosure at the end of this press release for a description and calculation of these measures.
2026 Exploration Budget
The 2026 global exploration budget has increased to a record $97 million, a 35% increase from the 2025 budget of $72 million. This includes expanded drill programs at the Island Gold District, Young-Davidson, and Lynn Lake and similar exploration budgets at the Mulatos District and Qiqavik. Approximately 62% of the 2026 budget is expected to be capitalized.
Island Gold District
A total of $43 million has been budgeted for exploration at the Island Gold District in 2026, up from $24 million spent in 2025. The exploration program will continue to build on the success from 2025 with high-grade gold mineralization extended across the Island Gold deposit, as well as within multiple structures within the hanging wall and footwall.
A significant focus of the 2025 drilling programs at Island Gold and Magino was on delineation drilling, which focused on conversion of the large Inferred Mineral Resource Base to Mineral Reserves. This program was executed successfully and resulted in a significant increase in Mineral Reserves at both Island Gold and Magino, which was incorporated into the Island Gold District Expansion study that was announced on February 3, 2026. With the deposit open laterally and at depth, there is significant potential for further growth in Mineral Reserves and Resources.
A total of 50,000 metres ("m") of underground exploration drilling is planned in 2026 with a focus on defining new Mineral Reserves and Resources in proximity to existing production horizons and infrastructure. This includes drilling across the strike extent of main Island Gold deposit (E1E and C-Zones), as well as within a growing number of newly defined hanging-wall and footwall zones.
These potential high-grade Mineral Reserve and Resource additions would be low cost to develop, given their proximity to existing infrastructure, and provide increased operational flexibility as mining rates increase. To support the underground exploration program, 1,090 m of underground exploration drift development is planned to extend drill platforms on the multiple levels.
Additionally, 48,000 m of surface exploration drilling has been budgeted targeting the area between the Island Gold and Magino deposits, as well as the down-plunge extension of the Island Gold deposit, below a depth of 1,500 m.
Included within sustaining capital at Island Gold is 27,000 m of underground delineation drilling. The focus of the delineation drilling at Island Gold is the ongoing conversion of the Mineral Resource base to Mineral Reserves.
The regional exploration program at the Island Gold District includes 16,000 m of surface drilling. The focus of the regional program will be following up on high-grade mineralization intersected in the 2025 drill program at Cline and Pick located approximately seven kilometres (“km”) northeast of the Island Gold mine. Drilling will also be completed at the historic Edwards Mine, located in proximity to the Cline and Pick mines with the objective of extending mineralization beyond historically mined areas.
Drilling will also be completed at the Island Gold North Shear target, and to the east and along strike from the Island Gold mine to test the extension of the E1E-zone.
Young-Davidson
A total of $17 million has been budgeted for exploration at Young-Davidson in 2026, up from $13 million spent in 2025. This includes 48,000 m of underground exploration drilling focused on two primary areas. The first is to continue to extend mineralization within the Young-Davidson syenite, which hosts the majority of Mineral Reserves and Mineral Resources. The second is to test and expand on higher grade gold mineralization that has been intersected within two areas of focus in the hanging wall of the deposit as outlined in a press release issued on January 30, 2026. This new style of higher-grade mineralization is located in close proximity to the existing mid-mine infrastructure, with grades intersected well above the current Mineral Reserve grade.
To support the underground exploration program, 200 m of underground exploration development is planned which includes further extension of the 9620-level hanging wall exploration drift that was completed in 2025. The regional program includes 10,000 m of drilling focused on evaluating several targets including the Otisse NE target and the Biralger target located approximately 3 km and 17 km northeast of Young-Davidson, respectively. A comprehensive data compilation project commenced in 2025, and will be completed in 2026 for the Wydee and Matachewan projects, both acquired in 2024, and located to the west and east of Young-Davidson, respectively. Additional targets are expected to be generated from the results of this work.
Young-Davidson has a 14-year Mineral Reserve life as of the end of 2024 and has maintained at least a 13-year Mineral Reserve life since 2011 reflecting ongoing exploration success. With the deposit open at depth and to the west, and new styles of higher-grade mineralization being intersected in the hanging wall, there is excellent potential for this track record to continue.
Mulatos District
A total of $21 million has been budgeted at Mulatos for exploration in 2026, consistent with $20 million spent in 2025. The regional drilling program is expected to total 44,500 m and includes 20,000 m of surface exploration drilling at the Cerro Pelon sulphide target, 9,000 m at the Halcon target (discovered in 2025), and an additional 15,500 m planned across several early to advanced staged targets within the Mulatos District. This drilling will follow up on another successful year of exploration in the Mulatos District with high-grade mineralization expanded beyond current Mineral Reserves and Resources at PDA and Cerro Pelon, as well as a new discovery at the Halcon target as outlined in a press release issued on January 21, 2026.
Lynn Lake
A total of $6 million has been budgeted for exploration at the Lynn Lake project in 2026. This is up from $3 million spent in 2025. The exploration budget includes 13,500 metres to test the potential for underground mining opportunities below the Gordon and MacLellan open pits.
Qiqavik
A total of $7 million has been budgeted for exploration at the Qiqavik project in 2026, similar to 2025. The project was acquired in April 2024 through the acquisition of Orford Mining.
Qiqavik is a camp-scale property covering 60,400 ha in the Cape Smith Greenstone Belt in Nunavik, Quebec. The Qiqavik project covers 50 km of strike covering prospective gold hosting environments and several major crustal-scale structures such as the Qiqavik break and the Bergeron fault. Early-stage exploration completed to date indicates that high-grade gold occurrences are controlled by structural splays off the Qiqavik Break.
The 2026 exploration program will follow up on discoveries made across several target areas during the 2025 drill program, and test the next series of highest priority targets as outlined in a press release dated January 28, 2026. At total of 8,000 m of helicopter-supported exploration drilling is planned in 2026. The 2026 program will also focus on advancing other targets across the belt with ongoing geological mapping, drone magnetics, prospecting, and additional till sampling.
The success of this early-stage greenfield drilling program across multiple target areas continues to support the significant gold endowment potential of the Qiqavik Project.
Assumptions and Sensitivities
| Assumptions & Expenses | 2026 | |
| Gold price | $/oz | $4,000 |
| Canadian dollar | USD/CAD | $0.74:1 |
| Mexican peso | MXN/USD | 18.5:1 |
| Amortization | $/oz | $400 |
| General & Administrative(1) | $ millions | $45 |
(1) Excludes stock-based compensation.
The 2026 to 2028 production, operating cost and capital guidance is based on a gold price assumption of $4,000 per ounce, a USD/CAD foreign exchange rate of $0.74:1 and MXN/USD foreign exchange rate of 18.5:1. Cost assumptions for 2027 and 2028 are based on 2026 input costs and have not been increased to reflect potential inflation in those years. These estimates may be updated in the future to reflect inflation beyond what is currently forecast for 2026.
Amortization expense in 2026 is expected to total $400 per ounce, consistent with 2025 amortization. General and administrative expenses are expected to total $45 million in 2026 (excluding stock-based compensation). Stock-based compensation is expected to total $25 million (excluding mark-to-market adjustments) and is included in AISC guidance.
The Company-wide effective tax rate in 2026 is expected to be approximately 34%. Cash taxes attributable to the Mulatos District and Canadian operations are expected to total between $160 and $180 million globally in 2026 based on a budgeted gold price of $4,000 per ounce, with approximately half of this amount expected to be paid in the first quarter. Given the rapid increase in gold prices over the past two years, existing tax pools in Canada are being utilized at a faster pace with nearly half the global cash taxes to be paid in Canada in 2026.
| Sensitivities | 2026 | Operating Sites Local Currency Exposure | Change | Free Cash Flow Sensitivity (1) |
| Gold price | $4,000 | - | $100 | ~$45 - 50 million |
| USD/CAD | $0.74:1 | 95% | $0.05 | ~$65 - 75 million |
| MXN/USD | 18.5:1 | 45% | 1.00 | ~$6 - 8 million |
(1) Free cash flow sensitivities include the impact of foreign exchange and short-term gold hedging arrangements noted below.
Current foreign exchange and gold hedging commitments
The Company has entered into the following foreign exchange and short-term hedging arrangements to date:
- Canadian dollar: approximately 35% of Canadian dollar-denominated operating and capital costs for 2026 have been hedged, ensuring a maximum USD/CAD foreign exchange rate of $0.75:1, and allowing the Company to participate in weakness in the USD/CAD down to an average rate of $0.70:1
- Mexican peso: approximately 12% of Mexican peso-denominated operating and capital costs in 2026 have been hedged, ensuring a minimum MXN/USD foreign exchange rate of 18.7:1 and allowing the Company to participate in weakness in the MXN/USD up to an average rate of 21.5:1
- Eliminated half of 2026 legacy Argonaut gold hedges: The Company repurchased and eliminated forward sale contracts that were in place for the first half of 2026, totalling 50,000 ounces at an average price of $1,821 per ounce. These hedges were inherited as part of the Argonaut Gold acquisition in 2024. The cost to eliminate the hedges was $113.5 million, representing an effective price of $4,091 per ounce, providing further upside to current gold prices. This was funded by $63.5 million in cash, and a gold sale prepayment for consideration of $50.0 million in exchange for the delivery of 12,255 ounces in the first half of 2026. The ounces will be delivered monthly and recorded as revenue based on the prepay price of $4,166 per ounce. There will be no cash flow associated with the sale of these 12,255 ounces in 2026, with proceeds already received in 2025
- Remaining Argonaut legacy hedges total 100,000 ounces at an average price of $1,821 per ounce, with 50,000 ounces maturing in the second half of 2026, and the remaining 50,000 ounces maturing in the first half of 2027. The Company will continue to monitor opportunities to repurchase and eliminate the remaining contracts, having eliminated 230,000 of the initial 330,000 ounces that were inherited in 2024, prior to maturity
Qualified Persons
Chris Bostwick, Alamos’ Senior Vice President, Technical Services, who is a qualified person within the meaning of National Instrument 43-101 Standards of Disclosure for Mineral Projects, has reviewed and approved the scientific and technical information contained in this press release.
About Alamos
Alamos is a Canadian-based intermediate gold producer with diversified production from three operations in North America. This includes the Young-Davidson mine and Island Gold District in northern Ontario, Canada, and the Mulatos District in Sonora State, Mexico. Additionally, the Company has a strong portfolio of growth projects including the IGD Expansion, and the Lynn Lake project in Manitoba, Canada. Alamos employs more than 2,400 people and is committed to the highest standards of sustainable development. The Company’s shares are traded on the TSX and NYSE under the symbol “AGI”.
FOR FURTHER INFORMATION, PLEASE CONTACT:
| Scott K. Parsons |
| Senior Vice President, Corporate Development & Investor Relations |
| (416) 368-9932 x 5439 |
| Khalid Elhaj |
| Vice President, Business Development & Investor Relations |
| (416) 368-9932 x 5427 |
| ir@alamosgold.com |
The TSX and NYSE have not reviewed and do not accept responsibility for the adequacy or accuracy of this release.
Cautionary Note
This news release contains statements that constitute forward-looking information as defined under applicable Canadian and U.S. securities laws. All statements in this release other than statements of historical fact, which address events, results, outcomes or developments that Alamos (or, the “Company”) expects to occur are, or may be deemed to be, “forward-looking statements” and are based on expectations, estimates and projections as at the date of this release. Forward-looking statements are generally, but not always, identified by the use of forward-looking terminology such as "expect", "estimate", “assume”, “believe”, “anticipate”, “intend”, “projection”, “potential”, “outlook”, “future”, “plan”, “target”, “opportunity”, “budget”, “ongoing”, “on track” or variations of such words and phrases and similar expressions or statements that certain actions, events or results “may", "could”, “would", "might" or "will" be taken, occur or be achieved or the negative connotation of such terms.
Such statements in this release may include (without limitation) information, assumptions, expectations and guidance as to strategy, plans, and future financial and operating performance, such as those regarding: free cash flow; costs (including cash costs, AISC, mine-site AISC, capital expenditures, growth and sustaining capital, capitalized exploration, exploration spending); cost structure and anticipated declining cost profile; budgets; NPV and IRR calculations; payment of taxes; net asset value; gold and other metal price assumptions; foreign exchange rates; mining methodologies; underground development rates; mining, milling and processing rates; total mill feed and throughput rates; expected average recoveries; anticipated gold production, production rates, timing of production, further production potential and growth; gold grades; mine life; Mineral Reserve life; Mineral Reserves and Resources, conversion rates and growth; planned exploration, exploration potential, strategy, focusses, targets, budget, discovery cost, upside and anticipated results; reduction in greenhouse gas emissions; project-related risks; growth and improvement initiatives; project economics; value creation; size and profitability of operations; shareholder returns; outlooks for each of the Island Gold District (IGD), Young Davidson mine (YD), Mulatos District, the Lynn Lake project (LLP) and the Qiqavik Gold project, including (without limitation and in addition to the above): (i) at IGD, the Expansion Study, expectation that growth will be self-financed, mine plan, project milestones and timing and effects of completion of the IGD Expansion and the Phase 3+ Expansion Project, mill expansion, paste plant completion and commissioning dates, tailings expansion and infrastructure upgrades, and timing of the Magino mill’s connection to the electric grid and elimination of reliance on CNG; (ii) at YD, completion of a fourth ore pass, opportunity for mill expansion and sources of supplemental feed; (iii) at the Mulatos District, construction of, the development and mine plan for, and expected results from the Puerto Del Aire (PDA) project, ore from Cerro Pelon, and the Halcon target; (iv) at LLP, initial capital, project milestones, development of, mine plan for, and production projections and timing, and the Burnt Timber, Linkwood, Gordon and MacLellan deposits; and (v) at the Qiqavik Gold project, exploration potential; and any other statements that express management's expectations or estimates of future performance, operational, geological or financial results.
Alamos cautions that forward-looking statements are necessarily based upon several factors and assumptions that, while considered reasonable by Alamos at the time of making such statements, are inherently subject to significant business, economic, technical, legal, political and competitive uncertainties and contingencies. Known and unknown factors could cause actual results to differ materially from those projected in the forward-looking statements, and undue reliance should not be placed on such statements and information.
Such factors and assumptions include (without limitation): the actual results of current exploration activities; changes to current estimates of mineral reserves and mineral resources; conclusions of economic and geological evaluations; changes in project parameters as plans continue to be refined; operations may be exposed to illness, disease, epidemic or pandemic which may impact, among other things, the broader market; state and federal orders or mandates (including with respect to mining operations generally or auxiliary businesses or services required for the Company’s operations) in Canada, Mexico and other jurisdictions in which the Company does or may conduct business; the duration of regulatory responses to any illness, disease, epidemic or pandemic; changes in national and local government legislation, controls or regulations; failure to comply with environmental and health and safety laws and regulations; labour and contractor availability (and being able to secure the same on favourable terms); ability to sell or deliver gold doré bars; disruptions in the maintenance or provision of required infrastructure and information technology systems; fluctuations in the price of gold or certain other commodities such as, diesel fuel, natural gas, and electricity; operating or technical difficulties in connection with mining or development activities, including geotechnical challenges and changes to production estimates (which assume accuracy of projected ore grade, mining rates, recovery timing and recovery rate estimates and may be impacted by unscheduled maintenance); changes in foreign exchange rates (particularly the Canadian dollar, U.S. dollar, and Mexican peso); the impact of inflation; the potential impact of any tariffs, trade barriers and/or regulatory costs; employee and community relations; litigation and administrative proceedings; disruptions affecting operations; risks associated with the startup of new mines; availability of and increased costs associated with mining inputs and labour; delays in the development or updating of mine plans; delays in implementing growth and improvement initiatives; delays in construction, including with respect to the Phase 3+ expansion project, the Island Gold District Expansion, PDA and the Lynn Lake project; inherent risks and hazards associated with mining and mineral processing including environmental hazards, industrial accidents, unusual or unexpected formations, pressures and cave-ins; the risk that the Company’s mines may not perform as planned; uncertainty with the Company's ability to secure additional capital to execute its business plans; the speculative nature of mineral exploration and development, risks in obtaining and maintaining necessary licenses, permits and authorizations, contests over title to properties; expropriation or nationalization of property; political or economic developments in Canada or Mexico and other jurisdictions in which the Company does or may carry on business in the future; increased costs and risks related to the potential impact of climate change; the costs and timing of exploration, construction and development of new deposits; risk of loss due to sabotage, protests and other civil disturbances; the impact of global liquidity and credit availability and the values of assets and liabilities based on projected future cash flows; and business opportunities that may be pursued by the Company.
Additional risk factors that may affect the Company’s ability to achieve the expectations set forth in the forward-looking statements contained in this release are set out in the Company’s latest 40F/Annual Information Form and Management’s Discussion and Analysis, each under the heading “Risk Factors” available on the SEDAR+ website at www.sedarplus.ca or on EDGAR at www.sec.gov, and should be reviewed in conjunction with the information, risk factors and assumptions found in this release.
The Company disclaims any intention or obligation to update or revise any forward-looking statements whether as a result of new information, future events or otherwise, except as required by applicable law.
Note to U.S. Investors – Mineral Reserve and Resource Estimates
Unless otherwise indicated, all Mineral Resource and Mineral Reserve estimates included in this news release have been prepared in accordance with Canadian National Instrument 43-101 - Standards of Disclosure for Mineral Projects (“NI 43-101”) and the Canadian Institute of Mining, Metallurgy and Petroleum (the “CIM”) - CIM Definition Standards on Mineral Resources and Mineral Reserves, adopted by the CIM Council, as amended (the “CIM Standards”). NI 43-101 is a rule developed by the Canadian Securities Administrators, which established standards for all public disclosure an issuer makes of scientific and technical information concerning mineral projects. Mining disclosure in the United States was previously required to comply with SEC Industry Guide 7 (“SEC Industry Guide 7”) under the United States Securities Exchange Act of 1934, as amended. The U.S. Securities and Exchange Commission (the “SEC”) has adopted final rules, to replace SEC Industry Guide 7 with new mining disclosure rules under sub-part 1300 of Regulation S-K of the U.S. Securities Act (“Regulation S-K 1300”) which became mandatory for U.S. reporting companies beginning with the first fiscal year commencing on or after January 1, 2021. Under Regulation S-K 1300, the SEC now recognizes estimates of “Measured Mineral Resources”, “Indicated Mineral Resources” and “Inferred Mineral Resources”. In addition, the SEC has amended its definitions of “Proven Mineral Reserves” and “Probable Mineral Reserves” to be substantially similar to international standards.
Investors are cautioned that while the above terms are “substantially similar” to CIM Definitions, there are differences in the definitions under Regulation S-K 1300 and the CIM Standards. Accordingly, there is no assurance any mineral reserves or mineral resources that the Company may report as “proven mineral reserves”, “probable mineral reserves”, “measured mineral resources”, “indicated mineral resources” and “inferred mineral resources” under NI 43-101 would be the same had the Company prepared the mineral reserve or mineral resource estimates under the standards adopted under Regulation S-K 1300. U.S. investors are also cautioned that while the SEC recognizes “measured mineral resources”, “indicated mineral resources” and “inferred mineral resources” under Regulation S-K 1300, investors should not assume that any part or all of the mineralization in these categories will ever be converted into a higher category of mineral resources or into mineral reserves. Mineralization described using these terms has a greater degree of uncertainty as to its existence and feasibility than mineralization that has been characterized as reserves. Accordingly, investors are cautioned not to assume that any measured mineral resources, indicated mineral resources, or inferred mineral resources that the Company reports are or will be economically or legally mineable.
Cautionary non-GAAP Measures and Additional GAAP Measures
Note that for purposes of this section, GAAP refers to IFRS. The Company believes that investors use certain non-GAAP and additional GAAP measures as indicators to assess gold mining companies. They are intended to provide additional information and should not be considered in isolation or as a substitute for measures of performance prepared with GAAP. “Cash flow from operating activities before changes in non-cash working capital” is a non-GAAP performance measure that could provide an indication of the Company’s ability to generate cash flows from operations and is calculated by adding back the change in non-cash working capital to “cash provided by (used in) operating activities” as presented on the Company’s consolidated statements of cash flows. “Cash flow per share” is calculated by dividing “cash flow from operations before changes in working capital” by the weighted average number of shares outstanding for the period. “Free cash flow” is a non-GAAP performance measure that is calculated as cash flows from operations net of cash flows invested in mineral property, plant and equipment and exploration and evaluation assets as presented on the Company’s consolidated statements of cash flows and that would provide an indication of the Company’s ability to generate cash flows from its mineral projects. “Mine site free cash flow” is a non-GAAP measure which includes cash flow from operating activities at, less capital expenditures at each mine site. “Return on equity” is defined as earnings from continuing operations divided by the average total equity for the current and previous year. “Mining cost per tonne of ore” and “cost per tonne of ore” are non-GAAP performance measures that could provide an indication of the mining and processing efficiency and effectiveness of the mine. These measures are calculated by dividing the relevant mining and processing costs and total costs by the tonnes of ore processed in the period. “Cost per tonne of ore” is usually affected by operating efficiencies and waste-to-ore ratios in the period. “Total capital expenditures per ounce produced” is a non-GAAP term used to assess the level of capital intensity of a project and is calculated by taking the total growth and sustaining capital of a project divided by ounces produced life of mine. “Growth capital” are expenditures primarily incurred at development projects and costs related to major projects at existing operations, where the projects will materially benefit the mine site. “Sustaining capital” are expenditures that do not increase annual gold ounce production at a mine site and excludes all expenditures at the Company’s development projects. “Total cash costs per ounce”, “all-in sustaining costs per ounce”, “mine-site all-in sustaining costs”, and “all-in costs per ounce” as used in this analysis are non-GAAP terms typically used by gold mining companies to assess the level of gross margin available to the Company by subtracting these costs from the unit price realized during the period. These non-GAAP terms are also used to assess the ability of a mining company to generate cash flow from operations. There may be some variation in the method of computation of these metrics as determined by the Company compared with other mining companies. In this context, “total cash costs” reflects mining and processing costs allocated from in-process and doré inventory and associated royalties with ounces of gold sold in the period. Total cash costs per ounce are exclusive of exploration costs. “All-in sustaining costs per ounce” include total cash costs, exploration, corporate and administrative, share based compensation and sustaining capital costs. “Mine-site all-in sustaining costs” include total cash costs, exploration, and sustaining capital costs for the mine-site, but exclude an allocation of corporate and administrative and share based compensation. “Capitalized exploration” are expenditures that meet the IFRS definition for capitalization and are incurred to further expand the known Mineral Reserve and Resource at existing operations or development projects. “Adjusted net earnings” and “adjusted earnings per share” are non-GAAP financial measures with no standard meaning under IFRS. “Adjusted net earnings” excludes the following from net earnings: foreign exchange gain (loss), items included in other loss, certain non-reoccurring items and foreign exchange gain (loss) recorded in deferred tax expense. “Adjusted earnings per share” is calculated by dividing “adjusted net earnings” by the weighted average number of shares outstanding for the period.
Additional GAAP measures that are presented on the face of the Company’s consolidated statements of comprehensive income and are not meant to be a substitute for other subtotals or totals presented in accordance with IFRS but rather should be evaluated in conjunction with such IFRS measures. This includes “Earnings from operations”, which is intended to provide an indication of the Company’s operating performance and represents the amount of earnings before net finance income/expense, foreign exchange gain/loss, other income/loss, and income tax expense. Non-GAAP and additional GAAP measures do not have a standardized meaning prescribed under IFRS and therefore may not be comparable to similar measures presented by other companies. A reconciliation of historical non-GAAP and additional GAAP measures are detailed in the Company’s Management’s Discussion and Analysis available at www.alamosgold.com.
Photos accompanying this announcement are available at:
https://www.globenewswire.com/NewsRoom/AttachmentNg/cf690ace-6d20-442c-be7b-a9f4ba27c29f
https://www.globenewswire.com/NewsRoom/AttachmentNg/84eff09e-2b6b-4d78-a907-bdabdde3c98b

![]()